Chart by Visualizer
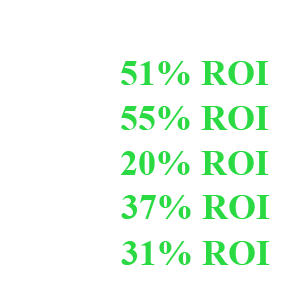
| Realized – Profit and Loss | ||||
| 2018 | 2019 | 2020 | 2021 | 2022 |
| 31% | 37% | 20% | 55% | 51% |
| Unrealized – Profit and Loss (Includes Investments not yet sold). |
||||
| 2018 | 2019 | 2020 | 2021 | 2022 |
| 19% | 21% | 15% | 27% | 32% |
| Projected Revenue of Prosper 2000 LLC |
||||
| 2018 | 2019 | 2020 | 2021 | 2022 |
| 15% | 20% | 21% | % | % |
|
Holding Log Term Investments May include Rental Properties, Mortgage Notes etc. generating positive cash flow |
||
| 2020 | 2021 | 2022 |
| 15% | 19% | 31% |
| Projected | Realized | Difference | |
| 2022 | 24% | 51% | 11% |
| 2021 | 18% | 55% | 37% |
| 2020 | 21% | 20% | -01% |
| 2019 | 20% | 37% | 17% |
| 2018 | 15% | 31% | 16% |


